Displaying images and plotting stuff with matplotlib.pyplot
The matplotlib.pyplot library is my go-to for easy generation of graphs, charts, histograms and anything that can be plotted, and recently I have also been using it lots for viewing images.
The only hitch is, I can never remember the syntax for basic, common things like displaying more than one plot at a time on a graph, or showing a graph with multiple lines and a matching legend box. I confess to having googled “pyplot subplots” a few too many times before writing up my own functions which do the job and are easy to use and remember.
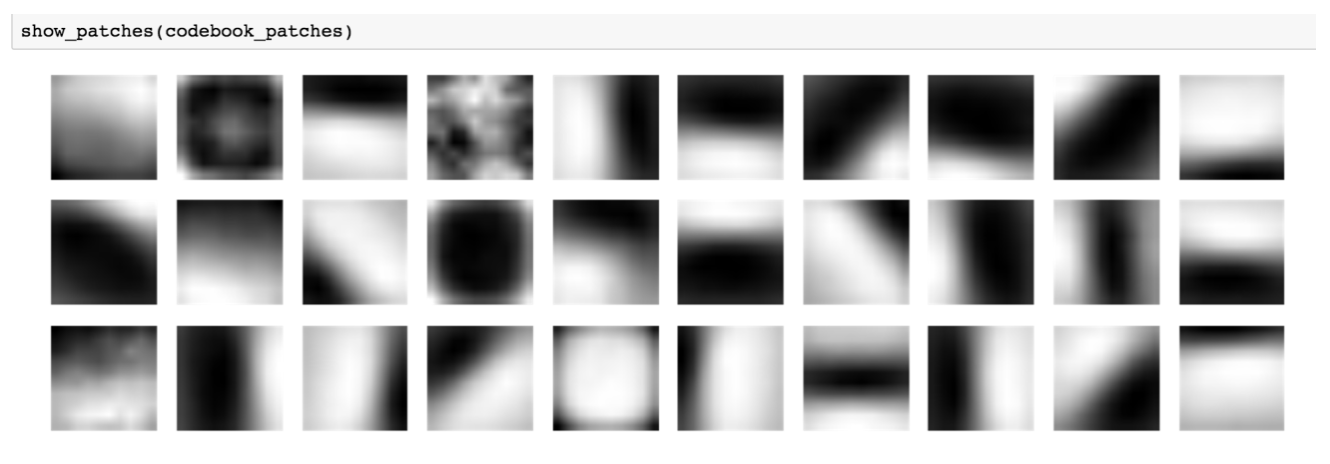
I’m terrible at open-sourcing code, but am working on making my non-academic work available. You can view, fork, clone or anything my little library here on GitHub. Here are a few examples of what it does at the moment. Displaying images in an N by N grid:

For easy displaying of small patches or windows, there’s also a built-in show_patches().

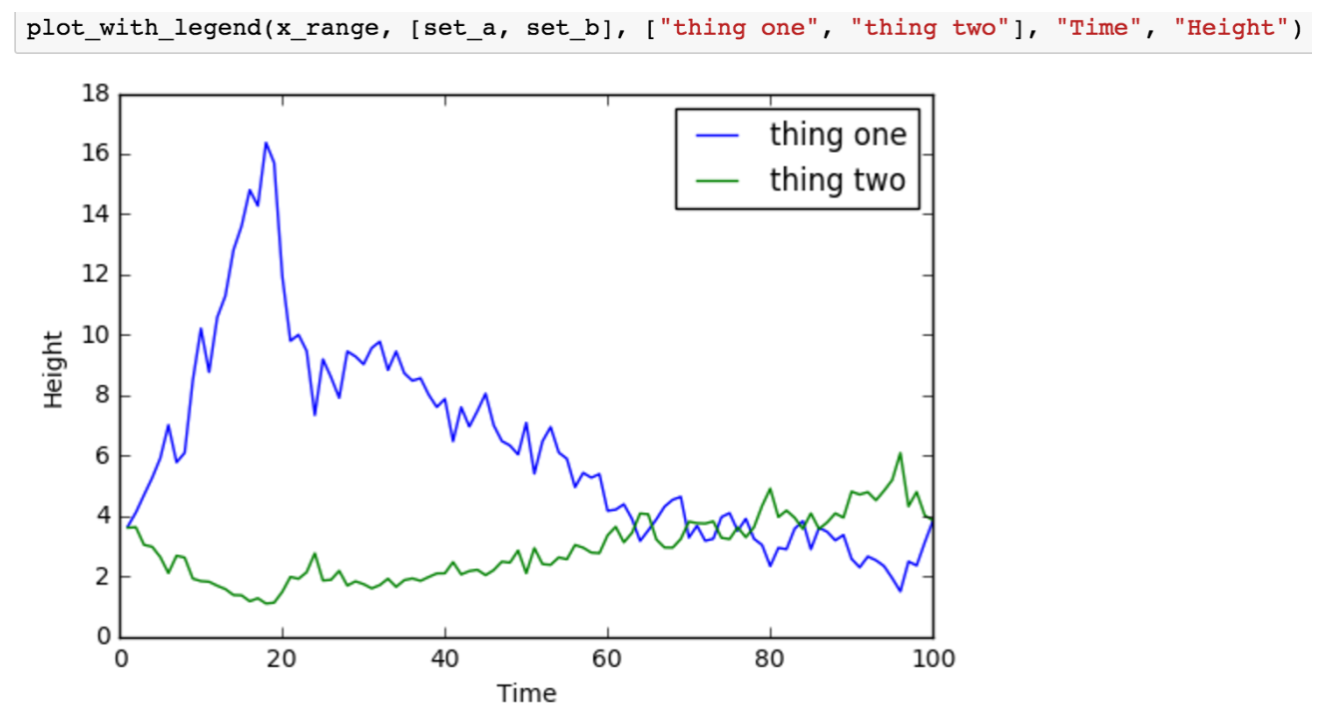
The matplotlib.pyplot legends API is straightforward enough, but for those who would rather not write the same six lines of code every time you need a graph with a legend, there’s this:

That’s it for now, more to follow.