Introducing py_wsi for computer analysis on whole slide .svs images using OpenSlide
A large, often unexpectedly time-consuming aspect of deep learning with whole slide images (WSI) is the data preparation phase. The images are gigabytes in size and simple things such as saving and loading patches can be painful. My new Python Package py_wsi allows for intuitive, painless patch sampling using OpenSlide, automatic labeling from Aperio ImageScope XML annotation files, and provides functions for saving these patches and their meta data into lightning memory-mapped databases. It is meant for fast prototyping, and will later include extensions to save to hdf5 files. The package can be forked from GitHub or installed via pip install py_wsi . It is highly recommended to download version >= 1.0.
An extension of the DataSet class from Hvass-Labs Tutorials shows how py_wsi can easily be used with dataset objects for training models and splitting into sets for k-fold cross validation.
Overview of functionality
Images, and in some cases code snippets, are worth a thousand words. First, take a look at this Jupyter notebook on GitHub for a run-through of the basic things py-wsi can do:
As a disclaimer, the whole slide images here are from the Breast Cancer Histology Challenge associated with the 2018 ICIAR conference. I am using these images as examples simply because they are publically available and are small enough (for .svs images), making them good test candidates. I have run py-wsi functions on my own research datasets which are considerably larger and can verify that they are scalable.
Understanding tiles, levels, tile dimensions, overlap, and patch sampling using OpenSlide
OpenSlide is a powerful library with an excellent Python API. Yet understanding how it works is not the most intuitive. Here is a general run-down with an attempt to address some common sources of confusion.
What is an .svs file? What is a tile?
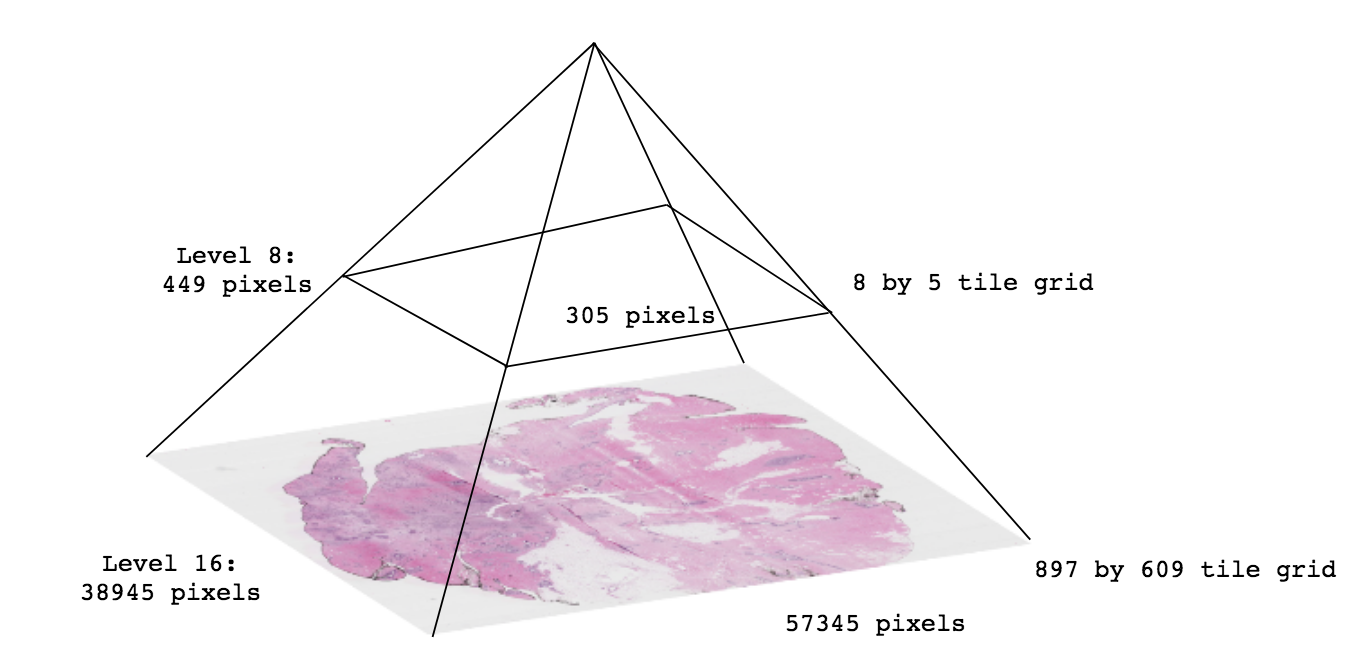
Essentially, an .svs file is a pyramid of tiled images. OpenSlide has an object called a DeepZoomGenerator which makes this pyramid accessible. Let’s look at an example.

Most .svs images have between 15-20 levels, depending on the magnification of the image (typically 20x-40x) and the whole slide scanner. We can see what is available by calling a py-wsi function:

Let’s go through these variables.
- Level count tells us how many resolutions of the image are available. We can think of a level as a magnification of the image.
- Level tiles tells us the dimensions of the tile grid on each level. Many of the low resolution levels only have a single tile (1 by 1 grid) meaning that the entire image is available as a single tile. At higher resolutions, we start to see much larger grids; in this example, the highest level is the 17th, and the dimensions of the tile grid at that level is 490 by 330.
- Level dimensions refer to the actual pixel dimensions of the entire grid at that level. The dimensions of the highest level are the actual, unscaled dimensions of the whole slide image. In the example, the original image is 62625 by 42113 pixels.
How is overlap calculated?
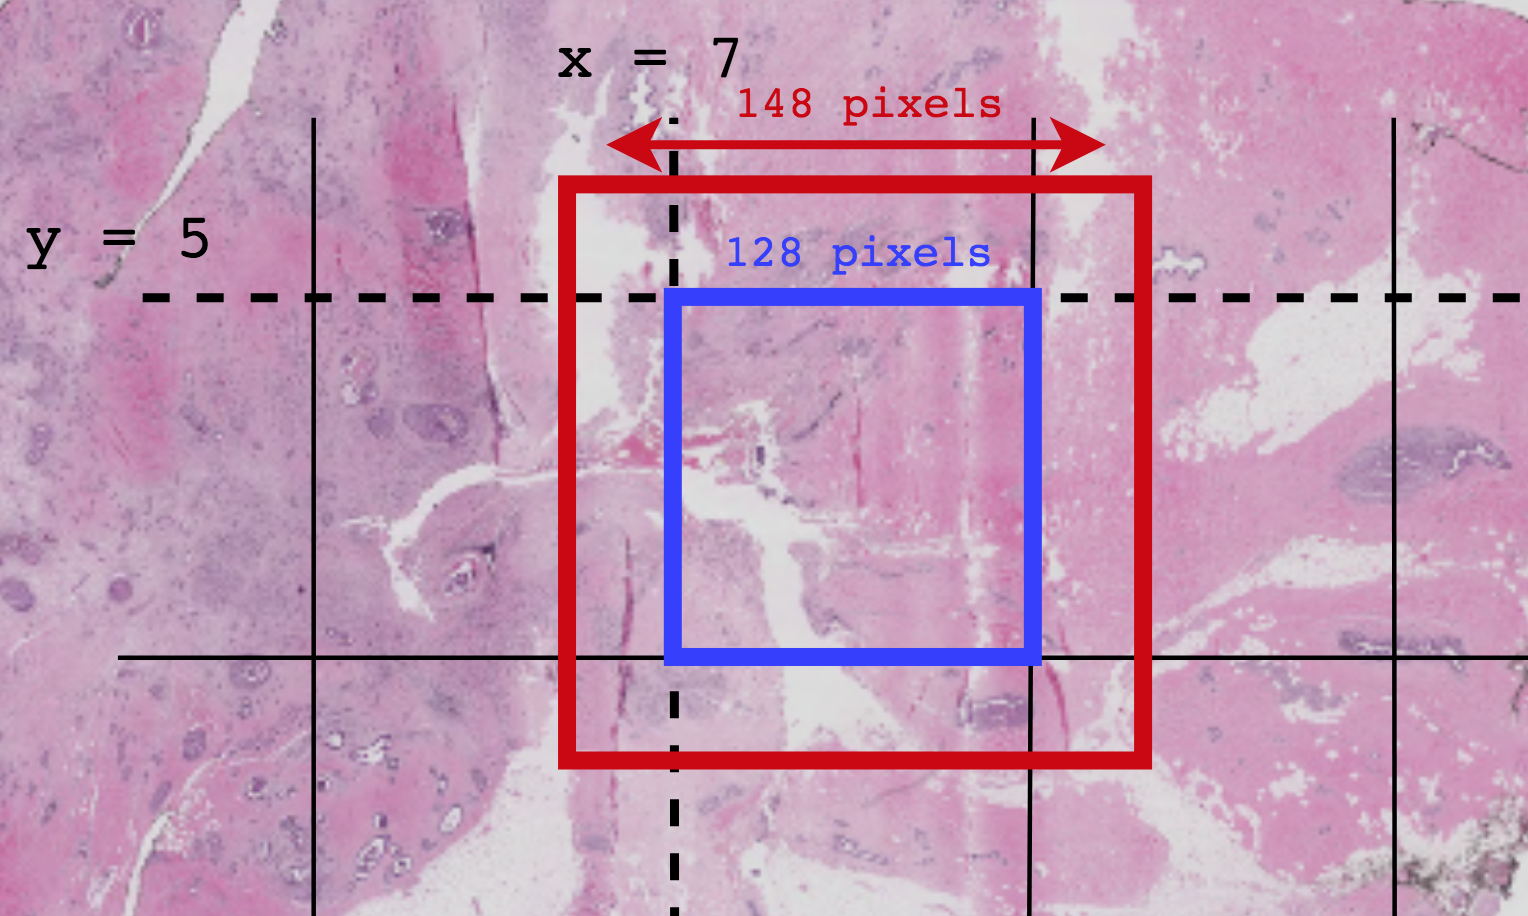
py-wsi uses the same system as the OpenSlide library for overlap. Overlap refers to the number of pixels added to each side of the tile centre. If you request a tile_size = 128 and a overlap = 10, you will be retrieving patches of size 148 x 148 x 3. This image shows what is happening for a patch being sampled at tile location (7, 5):

In an attempt to allow for more intuitive usage, py-wsi introduces a patch_size parameter instead of tile_size so that the patches retrieved will be patch_size * patch_size * 3 in size. These are internally converted to tile_size depending on the requested overlap.
patch_size = 256
level = 10
overlap = 10
test_patch = turtle.retrieve_sample_patch("test.svs", patch_size, level, overlap=overlap)
This more intuitively returns patches of size 256 x 256 x 3, and the conversion to tile dimensions is hidden behind the scenes.
Customising py-wsi memory management
Initial versions (< 1.0) of py-wsi sampled all patches from a single image at once, saving them in memory, and then committing them into the database in one single transaction. While this helped runtime, I quickly discovered that for most reasonable systems and typical WSI (100’s of thousands of pixels in width) the method was too memory-greedy. In current versions, the py-wsi manager (named Turtle) provides options to customise how many rows of the grid are read into memory at a time. This allows users to customise the balance between memory and sampling time depending on their resources.
turtle.sample_and_store_patches(patch_size, level, overlap, rows_per_txn=10)
A few notes on why (or why not) LMDB?
From www.LMDB.tech:
LMDB is a Btree-based database management library modeled loosely on the BerkeleyDB API, but much simplified. The entire database is exposed in a memory map, and all data fetches return data directly from the mapped memory, so no malloc’s or memcpy’s occur during data fetches. As such, the library is extremely simple because it requires no page caching layer of its own, and it is extremely high performance and memory-efficient. It is also fully transactional with full ACID semantics, and when the memory map is read-only, the database integrity cannot be corrupted by stray pointer writes from application code.
The library is fully thread-aware and supports concurrent read/write access from multiple processes and threads.
Lim et. al in “An analysis of image storage systems for scalable training of deep neural networks” compare the performance and memory costs of multiple image storage systems. LMDB closely rivals HDF5 depending on the scenario - note that HDF5 is a functionality I plan to add into py-wsi in later versions - and is superior for fast concurrent reads. Basically, LMDB is extremely fast because items are directly memory-mapped, faster than reading from a directory on disk.
Some of the strong arguments against using LMDB include:
- approximate database size must be known in advance (
py-wsicalculates this by quickly iterating over all the images and multiplying the tile size by the tile grid dimensions.) - larger patch sizes result in more overflow pages, which may affect performance
- not the most memory-efficient storage method (note the superlative)
Conclusion
I hope this was helpful somewhat to those who are getting used to navigating whole slide images. py-wsi is still in its early stages, so feel welcome to submit any issues on the GitHub page. If you have suggestions for additional functionality, I invite you to fork the project and submit a pull request!